



About US Ethnicity Map
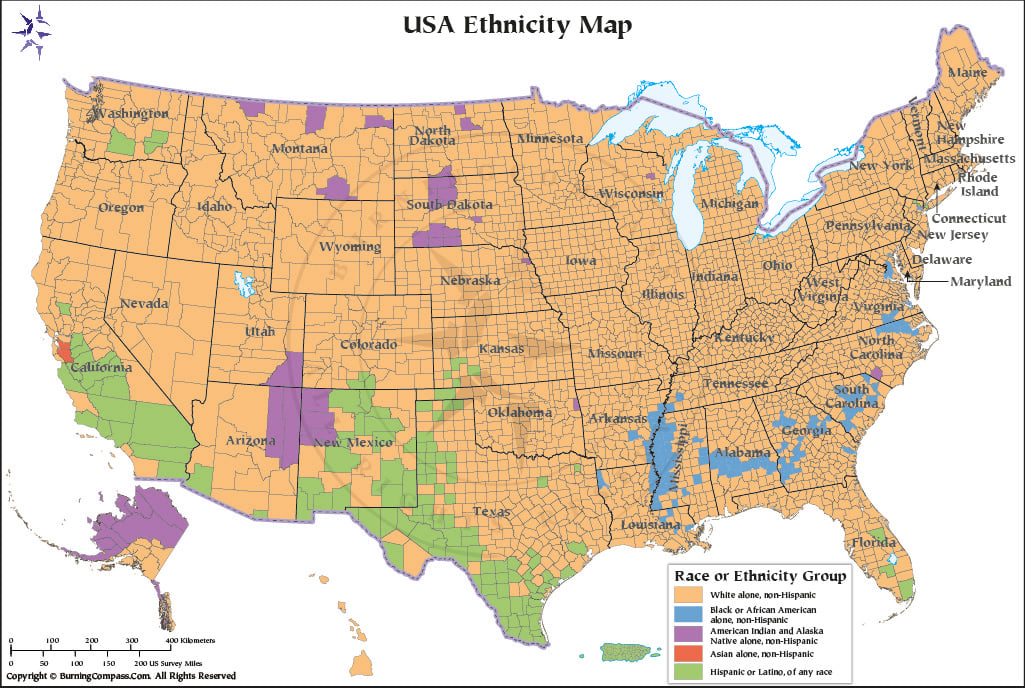
The USA Ethnicity Map for each state displays the predominant ethnic group of the population residing in the counties of each state. Each ethnic group is represented by a different color. The regional distributions of the different ethnic groups throughout the country are highlighted. State and county boundaries and names, as well as the principal physical and cultural geographical features, are displayed. The two non-continental states, Alaska and Hawaii, are included in the maps for all 50 states.
US Ethnicity
The United States is one of the world’s most ethnically diverse countries. It is home to Indigenous peoples and is a country of immigration, with peoples having arrived over the centuries. Many were brought as slaves and later freed; others arrived as immigrants from around the world. Today, the ethnic geography of the country varies from state to state, from county to county, and from city to city. According to the 2020 U.S. Census, the total population of the United States was 331,449,281. The Diversity Index for the country in 2020 was 61.1%, increasing from 54.9% in 2010. The Census Bureau Diversity Index is the probability that 2 randomly selected individuals are a different race or ethnicity.
Race and Ethnicity in the United States
In U.S. Census statistics, race and ethnicity are two different concepts that are typically collected separately by the Census Bureau. For example, a person of any race may identify as being of Hispanic or Latino ethnicity, and thus a US ethnicity map would use the category of Hispanic or Latino of any race. In contrast, the categories of White alone, Black or African American alone, Asian alone, and American Indian and Alaska Native alone are all of different racial categories.
To make Census statistics on racial and ethnic groups easier to map, and to avoid counting Hispanics within racial groups, analysts use groups that are considered to be mutually exclusive. These groups are: White alone non-Hispanic; Black or African American alone non-Hispanic; Asian alone non-Hispanic; and Hispanic or Latino of any race. These categories show which group is most dominant in any given state or county.
White Americans
Non-Hispanic white Americans remain the largest racial group in the U.S. Depending on whether or not to include Hispanic individuals of all races in the White population, they comprise 61.6% (or 204.3 million) of all individuals living in the U.S. in 2020 according to the U.S. Census Bureau, or 57.8% (or 191.7 million) if only non-Hispanic white individuals of all races are considered.
White non-Hispanic individuals are spread throughout the country and comprise the majority of racial/ethnic groups in nearly every state. California and New Mexico are two notable exceptions, where Hispanic or Latino individuals comprise the largest racial/ethnic group. Hawaii and the District of Columbia are also notable exceptions in which Asian non-Hispanic individuals and Black or African American non-Hispanic individuals comprise the largest racial/ethnic group, respectively.
Hispanic and Latino Americans
The population of Hispanic and Latino Americans comprise one of the largest groups of our country’s unique and diverse ethnicities. As of the 2020 Census, there were 62,080,044 Hispanic or Latino individuals residing in the United States, which accounts for approximately 18.7% of the country’s total population. It’s important to note that the Census Bureau classifies Hispanic or Latino individuals by ethnicity, not by race; therefore, individuals of this ethnicity can report one of the following races: White, Black or African American, American Indian and Alaska Native, Asian, or some other race, or multiple races.
In terms of geographic distribution, the Hispanic and Latino populations are mostly found in the Southwest and parts of the West and South. In New Mexico for example, the Hispanic population makes up a large majority of the population. In California for example, Hispanic or Latino residents make up 39.4% of the population in 2020 and thus become the largest racial or ethnic group in the state. This is up from 37.6% in 2010 when White alone non-Hispanic residents made up 52.7% of the population, followed by Hispanic or Latino residents at 37.6% and then Asian at 14.4%. In 2020, the White alone non-Hispanic residents make up 34.7% of the population in California.
Many other states in the Southwest, including Texas, Arizona, Nevada, Florida, and others, as well as counties throughout the region, have sizable Hispanic and Latino populations. While many of these locations have long-standing Hispanic and Latino communities who trace their roots to areas that were once part of Mexico or Spain, there are also large numbers of individuals from Mexico, as well as from Central America, South America, the Caribbean, and elsewhere.
Black and African American Population
In addition to Hispanic communities, there are also large and important Black and African American communities throughout the United States. According to Census 2020, there were approximately 39.94 million people who identified as Black or African American alone and of non-Hispanic origin.
A significant Black population resides in the deep South, spanning portions of Mississippi, Alabama, Georgia, Louisiana, and South Carolina as well as areas in adjacent states. This region is generally associated with the “Black Belt” of the South, which dates back to the day of slavery and the large plantations that operated there to support agricultural production. The settlement patterns of subsequent generations of African Americans have also had a lasting impact on population distribution within this region.
In addition to large concentrations of Black people in the South, many Black people reside in big cities in the Northeast, Midwest and West. Millions of African Americans from the South moved to these cities during the 20th century as part of the Great Migration. Large Black communities exist in cities like New York, Chicago, Philadelphia, Detroit and Los Angeles.
Asian American Population
Asian Americans are a very diverse ethnic group including people from East Asia, Southeast Asia and South Asia. There are approximately 19.62 million Asian alone, non-Hispanic residents in the United States, according to the 2020 Census.
These populations are found in greatest concentrations in the Western United States, including Hawaii, and in large metropolitan areas across the country. In the 2020 Census, Hawaii was the only state where Asian alone non-Hispanic residents were the largest racial or ethnic group. In California, the state with the largest Asian American population, Asian alone non-Hispanic residents comprised 15.1% of the population in 2020.
The Asian American population consists of individuals from many different national and ethnic origins including: Chinese, Indian, Filipino, Vietnamese, Korean, Japanese and many other ethnic groups and cultures. Thus, the term “Asian” is a broad Census category that includes many different cultures and ethnic groups.
American Indian and Alaska Native Population
Indigenous peoples in the United States today are American Indians and Alaska Natives. There are hundreds of federally recognized tribes as well as other tribes that are recognized by the state or nationally but not federally. In the 2020 Census, 2.25 million people reported that they were American Indian and Alaska Native alone and non-Hispanic. Including people who reported that they were American Indian and Alaska Native in combination with other races, there were over 9 million people in the United States who reported that they were Indigenous.
Native American populations can be found in concentrated numbers throughout many of the regions noted above. Specifically, in Arizona, New Mexico, South Dakota, North Dakota, Montana and in Alaska, large percentages of American Indian or Alaska Native persons reside in Tribal lands, reservations and Alaska Native communities and in the historical homelands of Indigenous peoples across the country.
Multiracial Population in the United States
According to the 2020 Census, 13.55 million non-Hispanic individuals reported being of two or more races within the non-Hispanic population alone. Some of the change between Census 2010 and Census 2020 may be attributable to changes in the design of the census questionnaire, data processing, and in the algorithms and coding used to assign individuals to racial categories. Thus, all change is not necessarily demographic population change.
Multiracial populations and identities play an important part in interpreting ethnicity maps. Many maps identify the ‘dominant’ ethnic group within a county, but this category will usually contain the greatest number by population, but not necessarily the majority. So there may be many individuals within that county who do not identify as part of that group at all.
Regional Patterns of US Ethnicity
Racial and ethnic composition is extremely regionally concentrated in the U.S., but composition by state alone does not capture the full variety of racial and ethnic composition within states. A closer look at the composition of individual counties reveals that in many cases of the Southwest, there are large numbers of Hispanics or Latinos of any race and American Indians. Meanwhile, the many Black people living in the Southeast are concentrated in individual counties. The large populations of Asian people in Hawaii and on the West Coast are also notable.
The distributions of these ethnic and racial groups have been influenced by a variety of historical events including indigenous settlement, European colonization and immigration, forced migration and slavery of Africans to the South, and subsequent immigration from a variety of places including Europe, Latin America, Asia, Africa, the Caribbean, and many other regions. Additionally, there have been significant internal migration flows which have further reshaped these ethnic and racial distributions across the country.
The Most Racially and Ethnically Diverse US States
The Diversity Index is a measure reported by the Census Bureau that complements a simple ethnic plurality tabulation and provides insight on the degree of ethnicity in the US population as a whole. Rather than ranking ethnic groups by size of population, it measures the probability that two randomly selected individuals would be of different racial or ethnic stock.
In 2020, Hawaii recorded the highest Diversity Index value of 76.0, followed by California at 69.7, Nevada at 68.8, Maryland at 67.3, Texas at 67.0, New York at 65.8, New Jersey at 65.8, Georgia at 64.1, Florida at 64.1, and New Mexico at 63.0. The three states with the lowest values for the index were Maine at 18.5, Vermont at 20.2, and West Virginia at 20.2. The national Diversity Index value increased to 61.1 in 2020 from 54.9 in 2010.
For the U.S. as a whole, the Diversity Index rose from 54.9% in 2010 to 61.1% in 2020, meaning that racial and ethnic diversity in the U.S. continued to increase in the last decade as measured by Census Bureau data.
Why US Ethnicity Data Matters
Understanding ethnicity in the US is more than just understanding the population compositions. Race and ethnicity data from the Census are used to implement and evaluate many federal programs and to enforce civil-rights laws in a variety of contexts. Equal employment opportunity, public health research, and assessing disparities as well as environmental and health risks all rely on such data.
Used with detailed Census tables, an ethnicity map is a useful tool for American geography for students, researchers, educators, business persons and others interested in the topic. The map in this web site provides insight into how history, migration, settlement and economic opportunity have influenced the demographic makeup of communities across America.
FAQs about US Ethnicity
Other US Maps
- US Map
- Detailed US Map
- Blank Map of US
- USA Karte
- Mapa de Estados Unidos
- Carte des États-Unis
- Mapa dos Estados Unidos
- USA Time Zone Map
- US National Parks Map
- US Regions Map
- US Rivers Map
- USA World Map
- USA on World Map
- US Cities Map
- US State Abbreviation Map
- US Road Map
- US Travel Map
- US Rail Map
- US Territory Map
- US Zip Code Map
- US Physical Map
- US County Map
- Blank US County Map
- US Population Map
- Richest Cities in US
- US International Airports Map
- US Flag Map
- US Map Upside Down
- US Temperature Map
- US Latitude and Longitude Map
- East Coast Map
- West Coast Map
- Western US Map
- US Interstate Map
- USA Seismic Zones Map
- US Canada Map
- US Mexico Map
- Southern US Map
- US Elevation Map
- US Map Black and White
- US Midwest Map
- US Northeast Map
- Amtrak Map
- 13 Colonies Map
- Washington DC Map
- Best Places to Visit in Summer in USA
- US on North America Map
- Southeast US Map
- US Mountain Ranges Map
- Southwest US Map
- Northwestern US Map
- US Map without Names
- US Canada Border Map
- US Area Code Map
- American Civil War Map
- US Road Trip Map
- US Volcano Map
- New England Map
- US Satellite Map
- US Desert Map
- US Map 1860
- US Map 1800
- US Map 1850
- US Lakes Map
- Where is Niagara Falls
- Where is Grand Canyon
- Where Mount Rushmore
- Where is Statue of Liberty
- Where is White House
- Where is Hoover Dam
- Where is Golden Gate Bridge
- Where is Hollywood Sign
- Where is Empire State Building
- Where is Monument Valley
- Where is Lincoln Memorial
- Where is Gateway Arch
- Where is Great Smoky Mountains
- Where is Sears Tower
- Where is Independence Hall
- Where is One World Trade Center
- US Climate Map
- Where is Rocky Mountains
- Where is Old Faithful Geyser
- US Capital
- US Map in Gujarati
- US Lightning Map
- US Snow Cover Map
- US Topographic Map
- Central US Map
- US Ethnicity Map